Analyze usage with GA
Brienne Wong
This feature is available on all Enterprise plans. Want this and other premium features? Update your plan here.
These instructions refer to Google Analytics UA. As of December 2021, GA4 is also supported.
Analyze styleguide usage
You can use analytics to measure the usage of your styleguide. For example, some questions you can answer:
- How many people are viewing the styleguide?
- Which pages are they viewing?
- Which components have been viewed?
- How are people navigating the styleguide?
- What are the most common search terms?
- Which design assets and attachments have been downloaded?
- How many people have copied design values?
- How many people have copied code snippets?
- How many people have used design tokens?
Where can you see events?
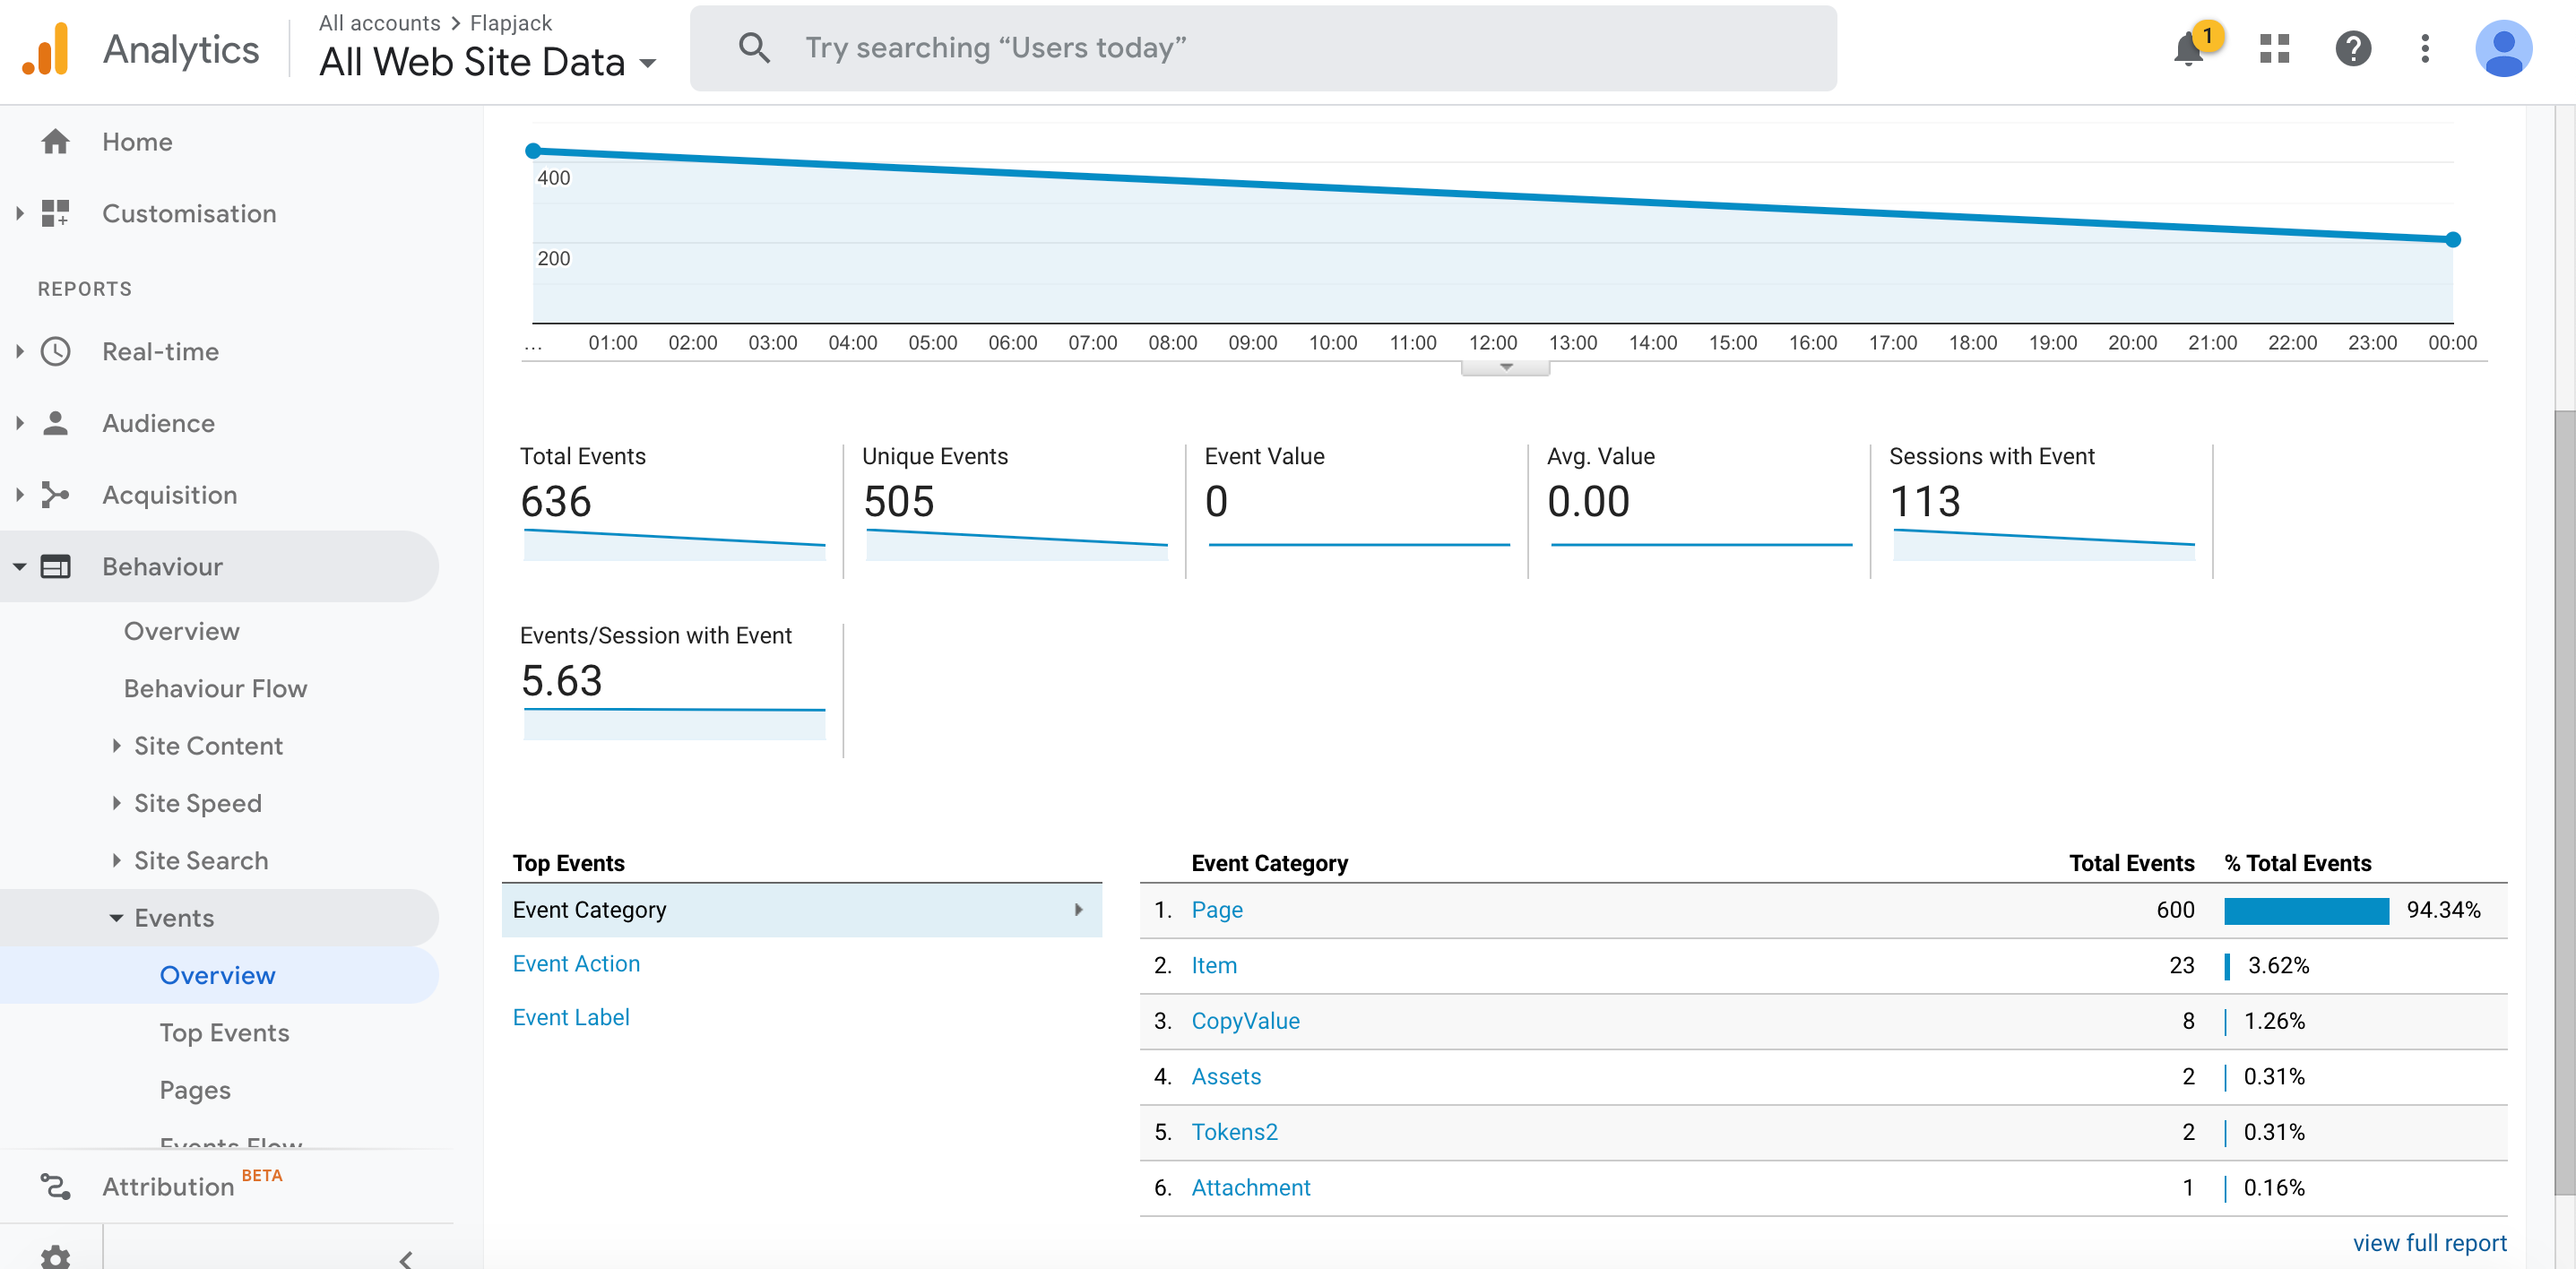
- Navigate to Behavior > Events > Overview
- You will see a list of events (see the full list of available events here)
- You can choose to display the Top Events by:
- Event Category e.g. Page, Item, Assets, Attachment
- Event Action e.g. View, Search, Copy, Download
- Event Label e.g. Page name, Search term
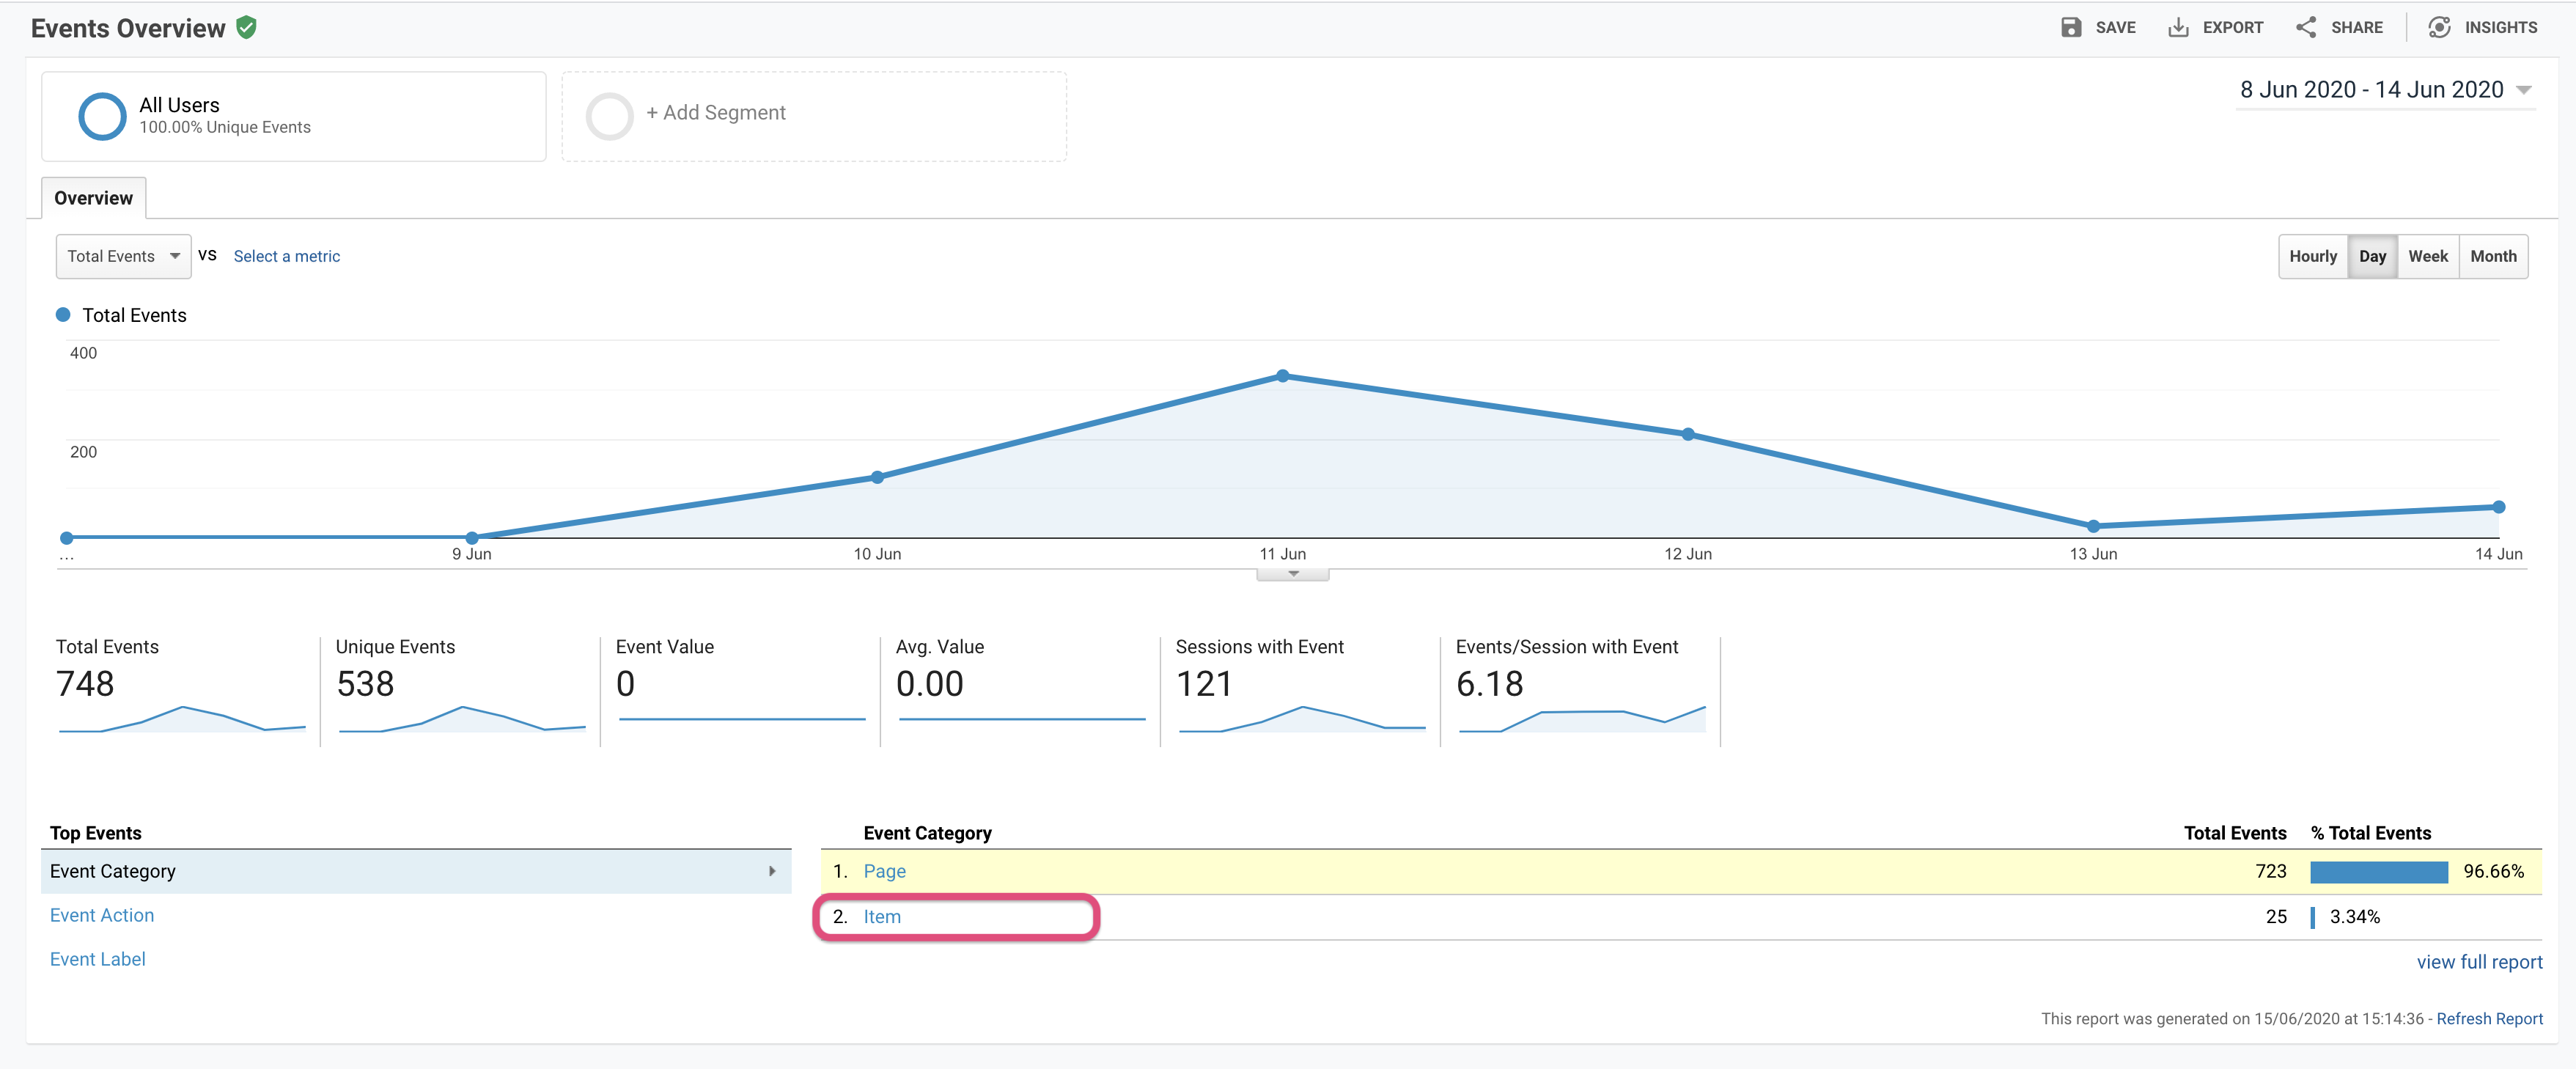
How many people have looked at the styleguide?
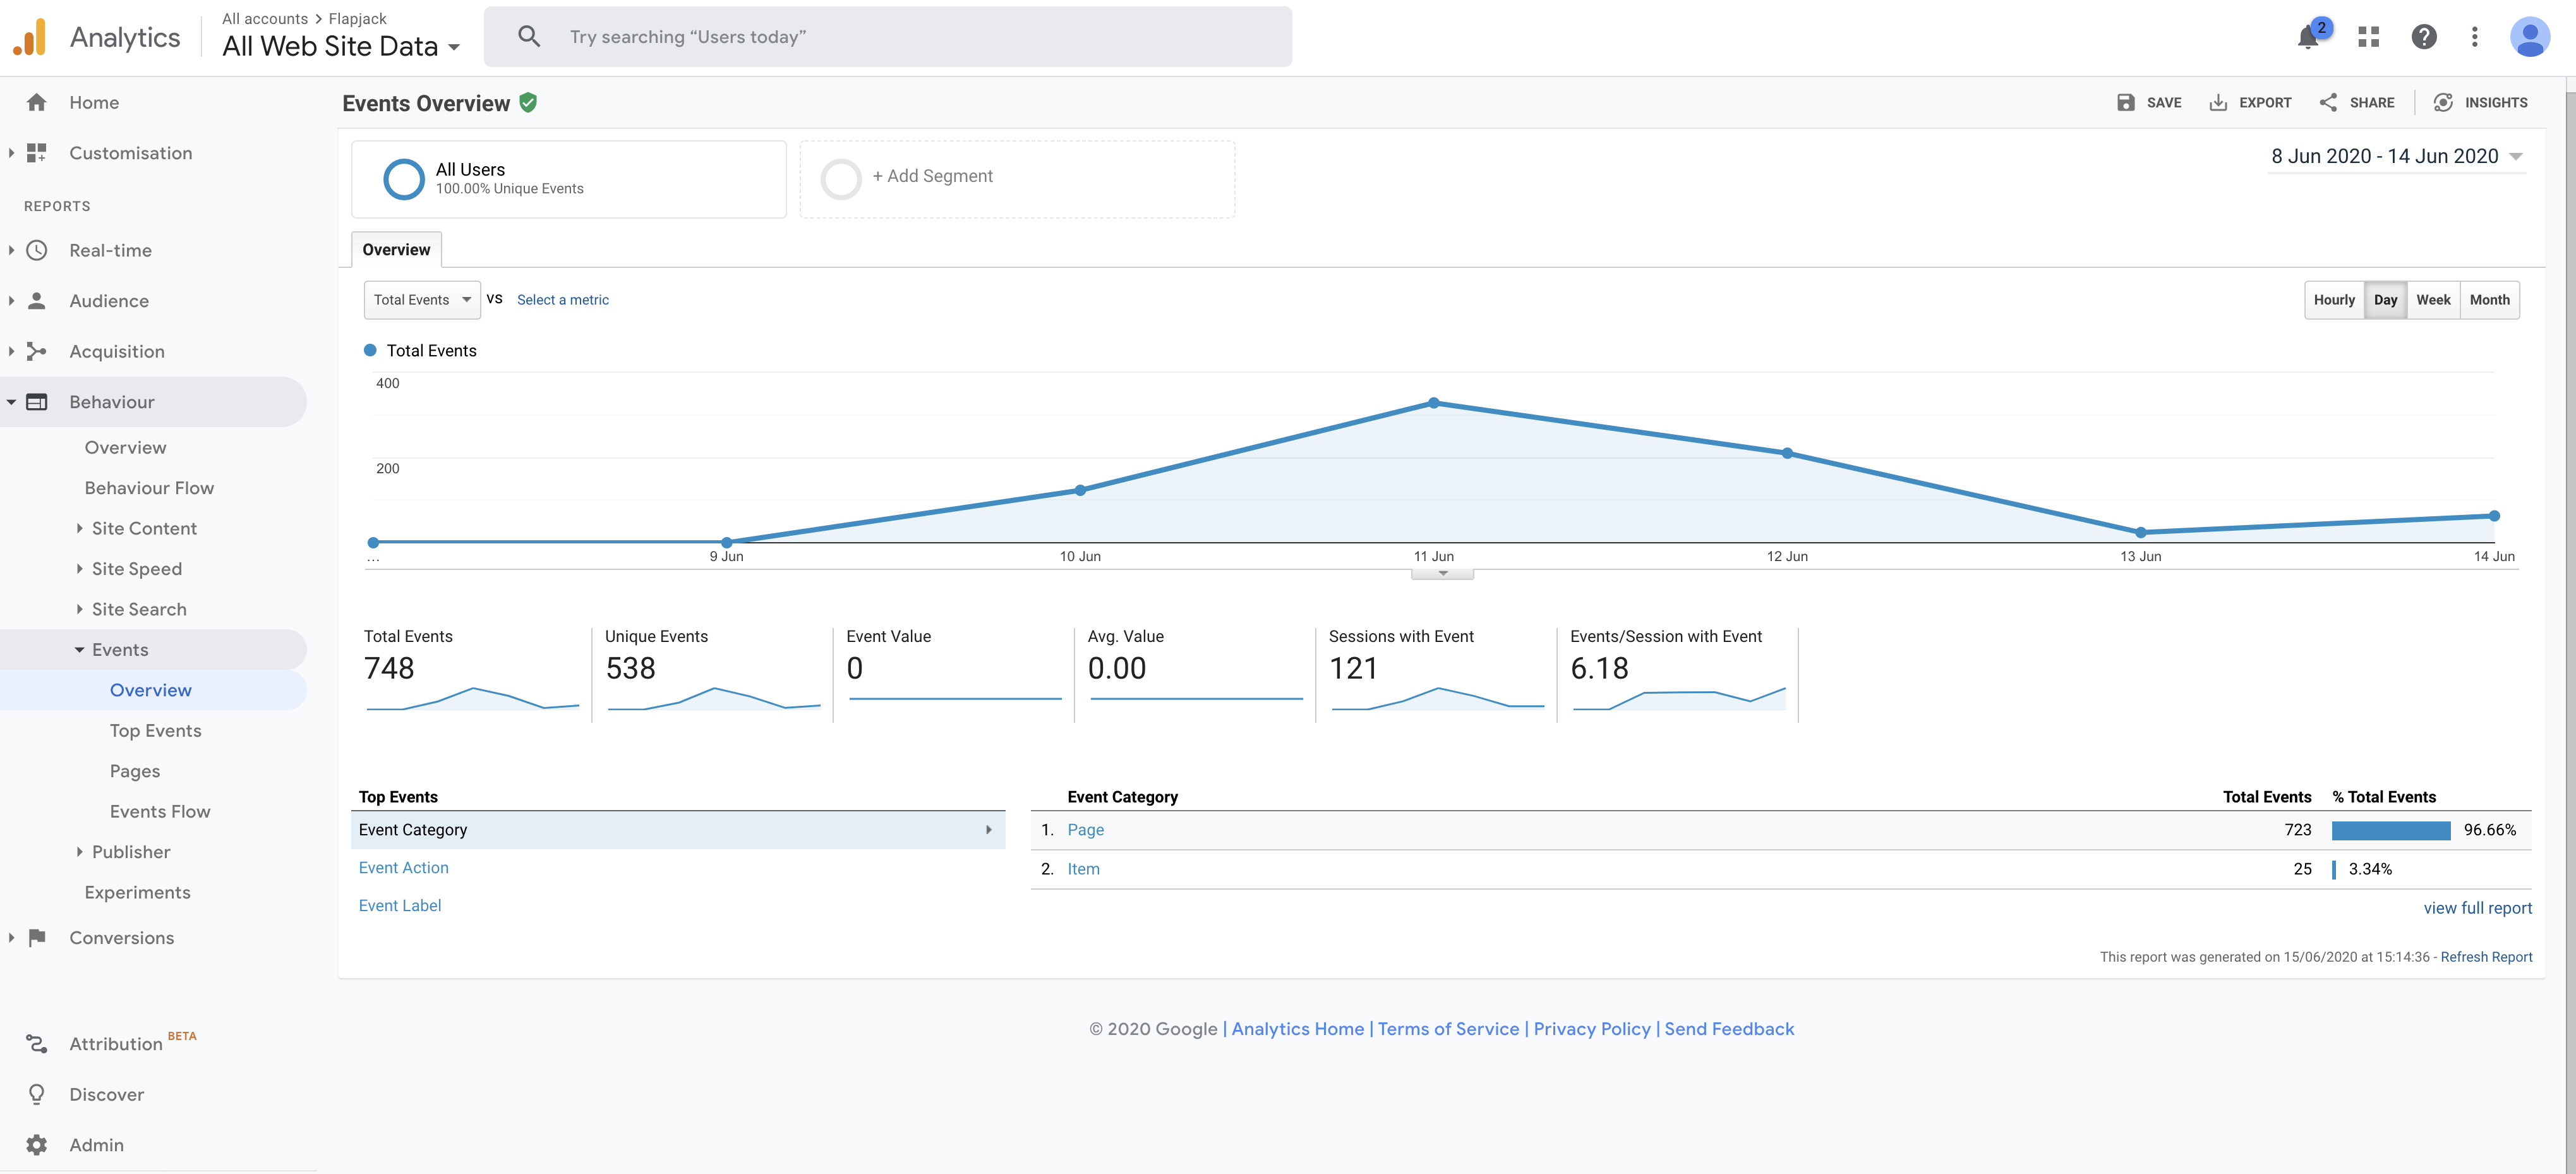
1) Click on the Behavior tab
2) Choose Events
3) This will show you the number of events over time, both page views and item views.
4) You can change the time period by selecting Hourly Day Week or Month from the option on the right.
5) The section Sessions with Event shows the number of unique sessions, which can be taken as the number of people who have viewed the styleguide.
Which pages are being viewed? Which pages are viewed the most/the least?
From the Events Overview, click on the Page Event Category
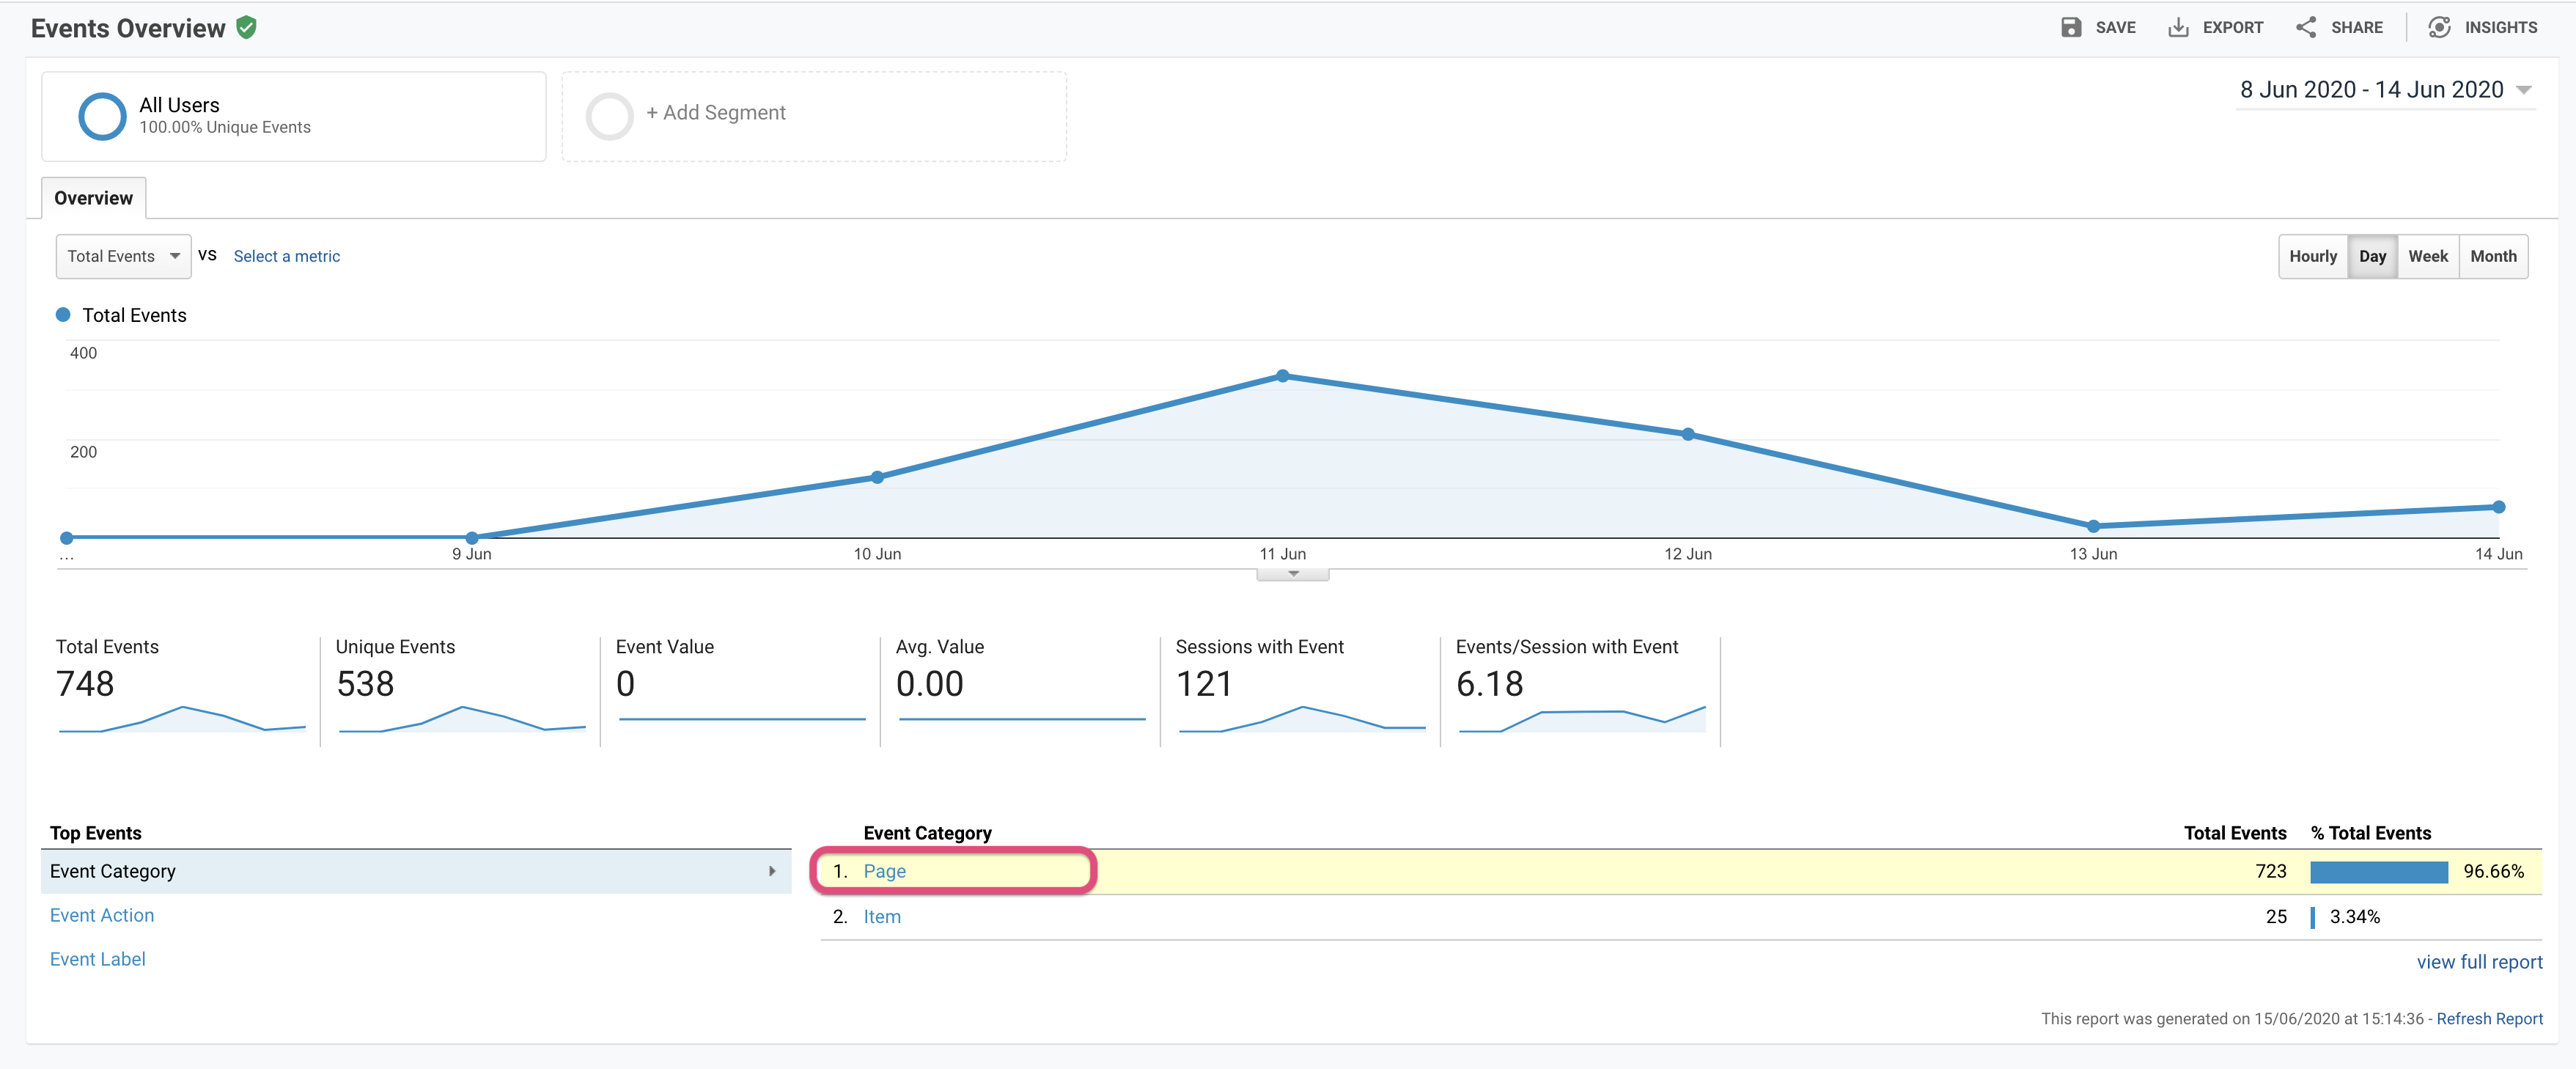
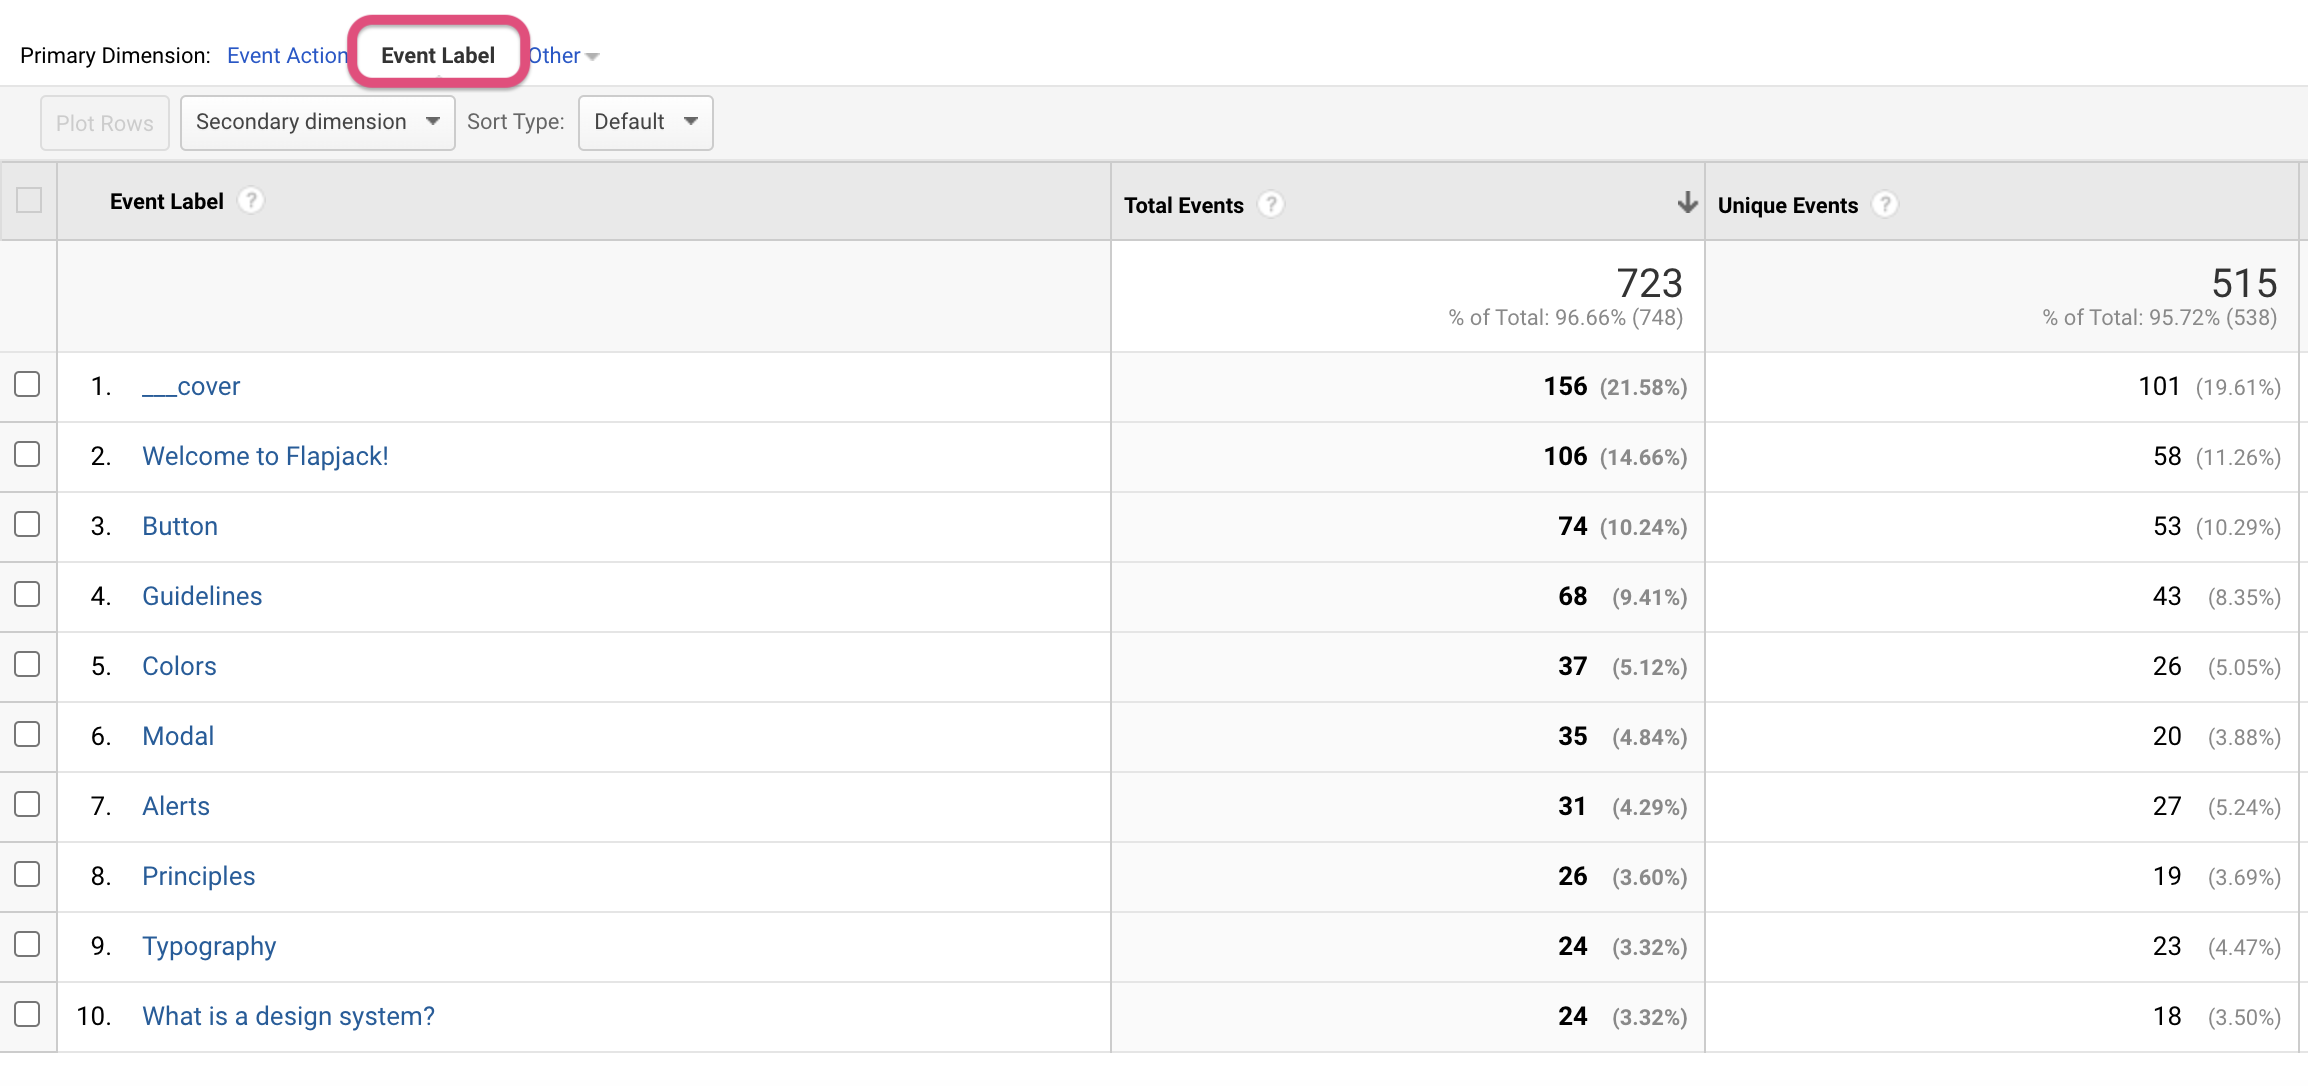
Then choose the Event Label tab. This will show you the pages of your styleguide that people have visited. They will be sorted by the number of events.
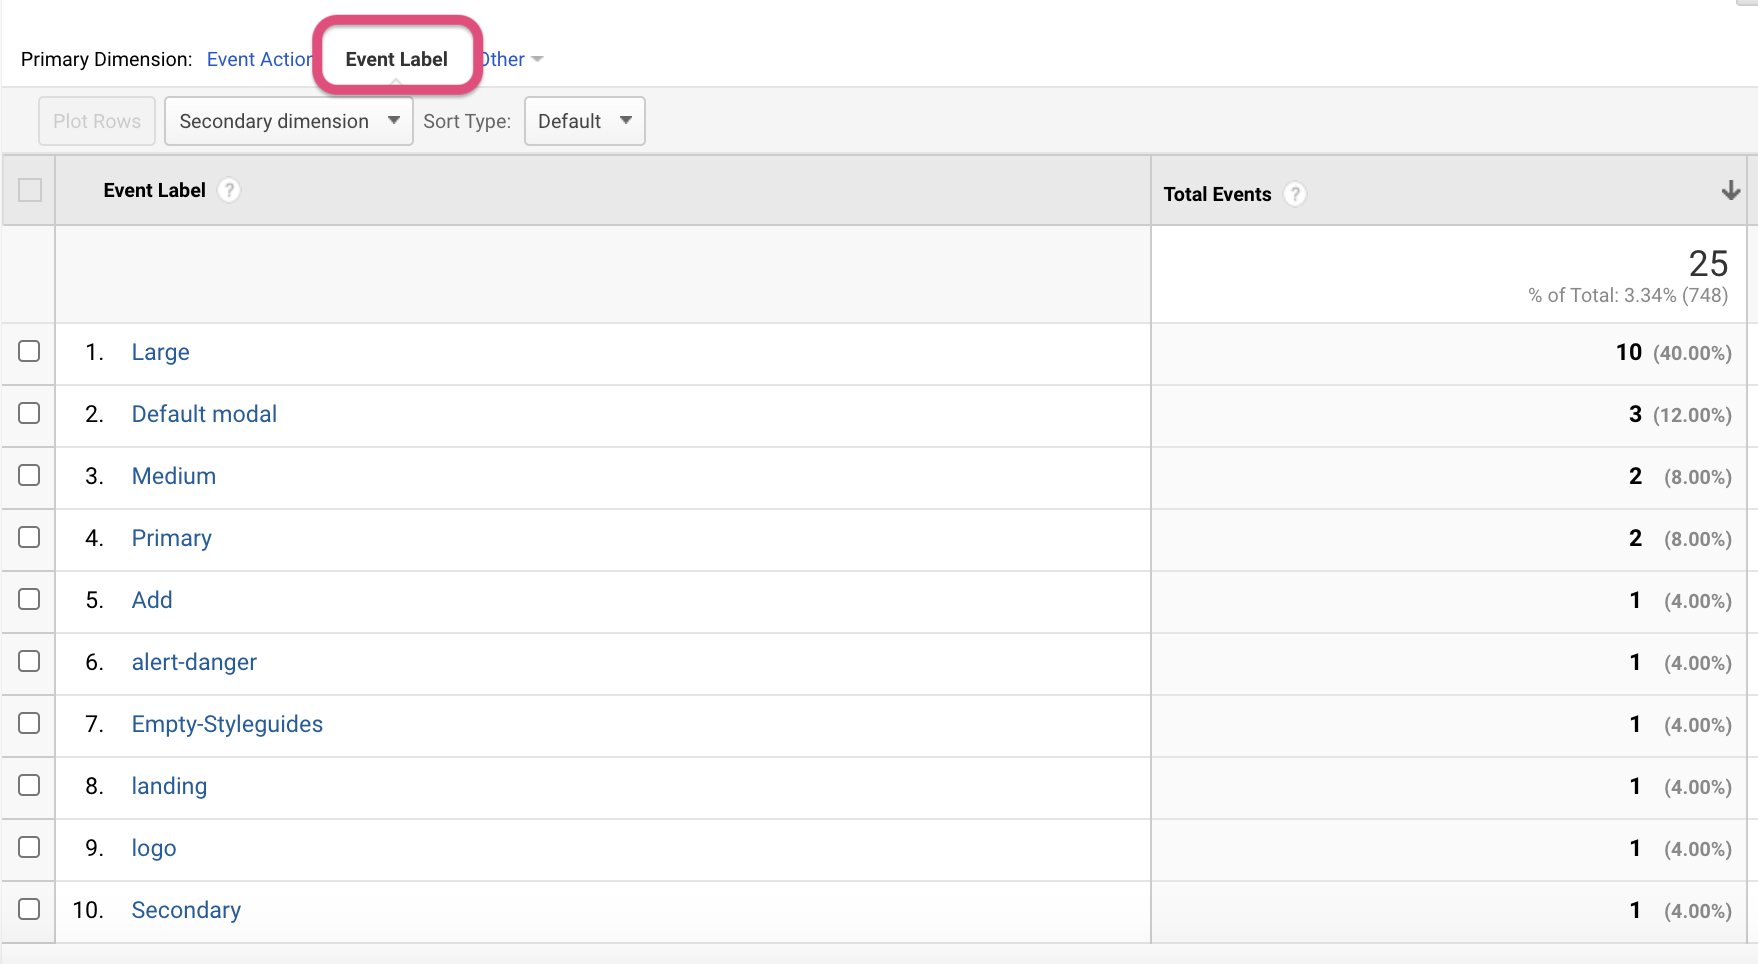
Which design system components have been viewed?
From the Events Overview, click on the Item Event Category
Then choose the Event Label tab. This will show you the components people have viewed. In this case, the Large call to action button is the most-viewed component in the documentation.
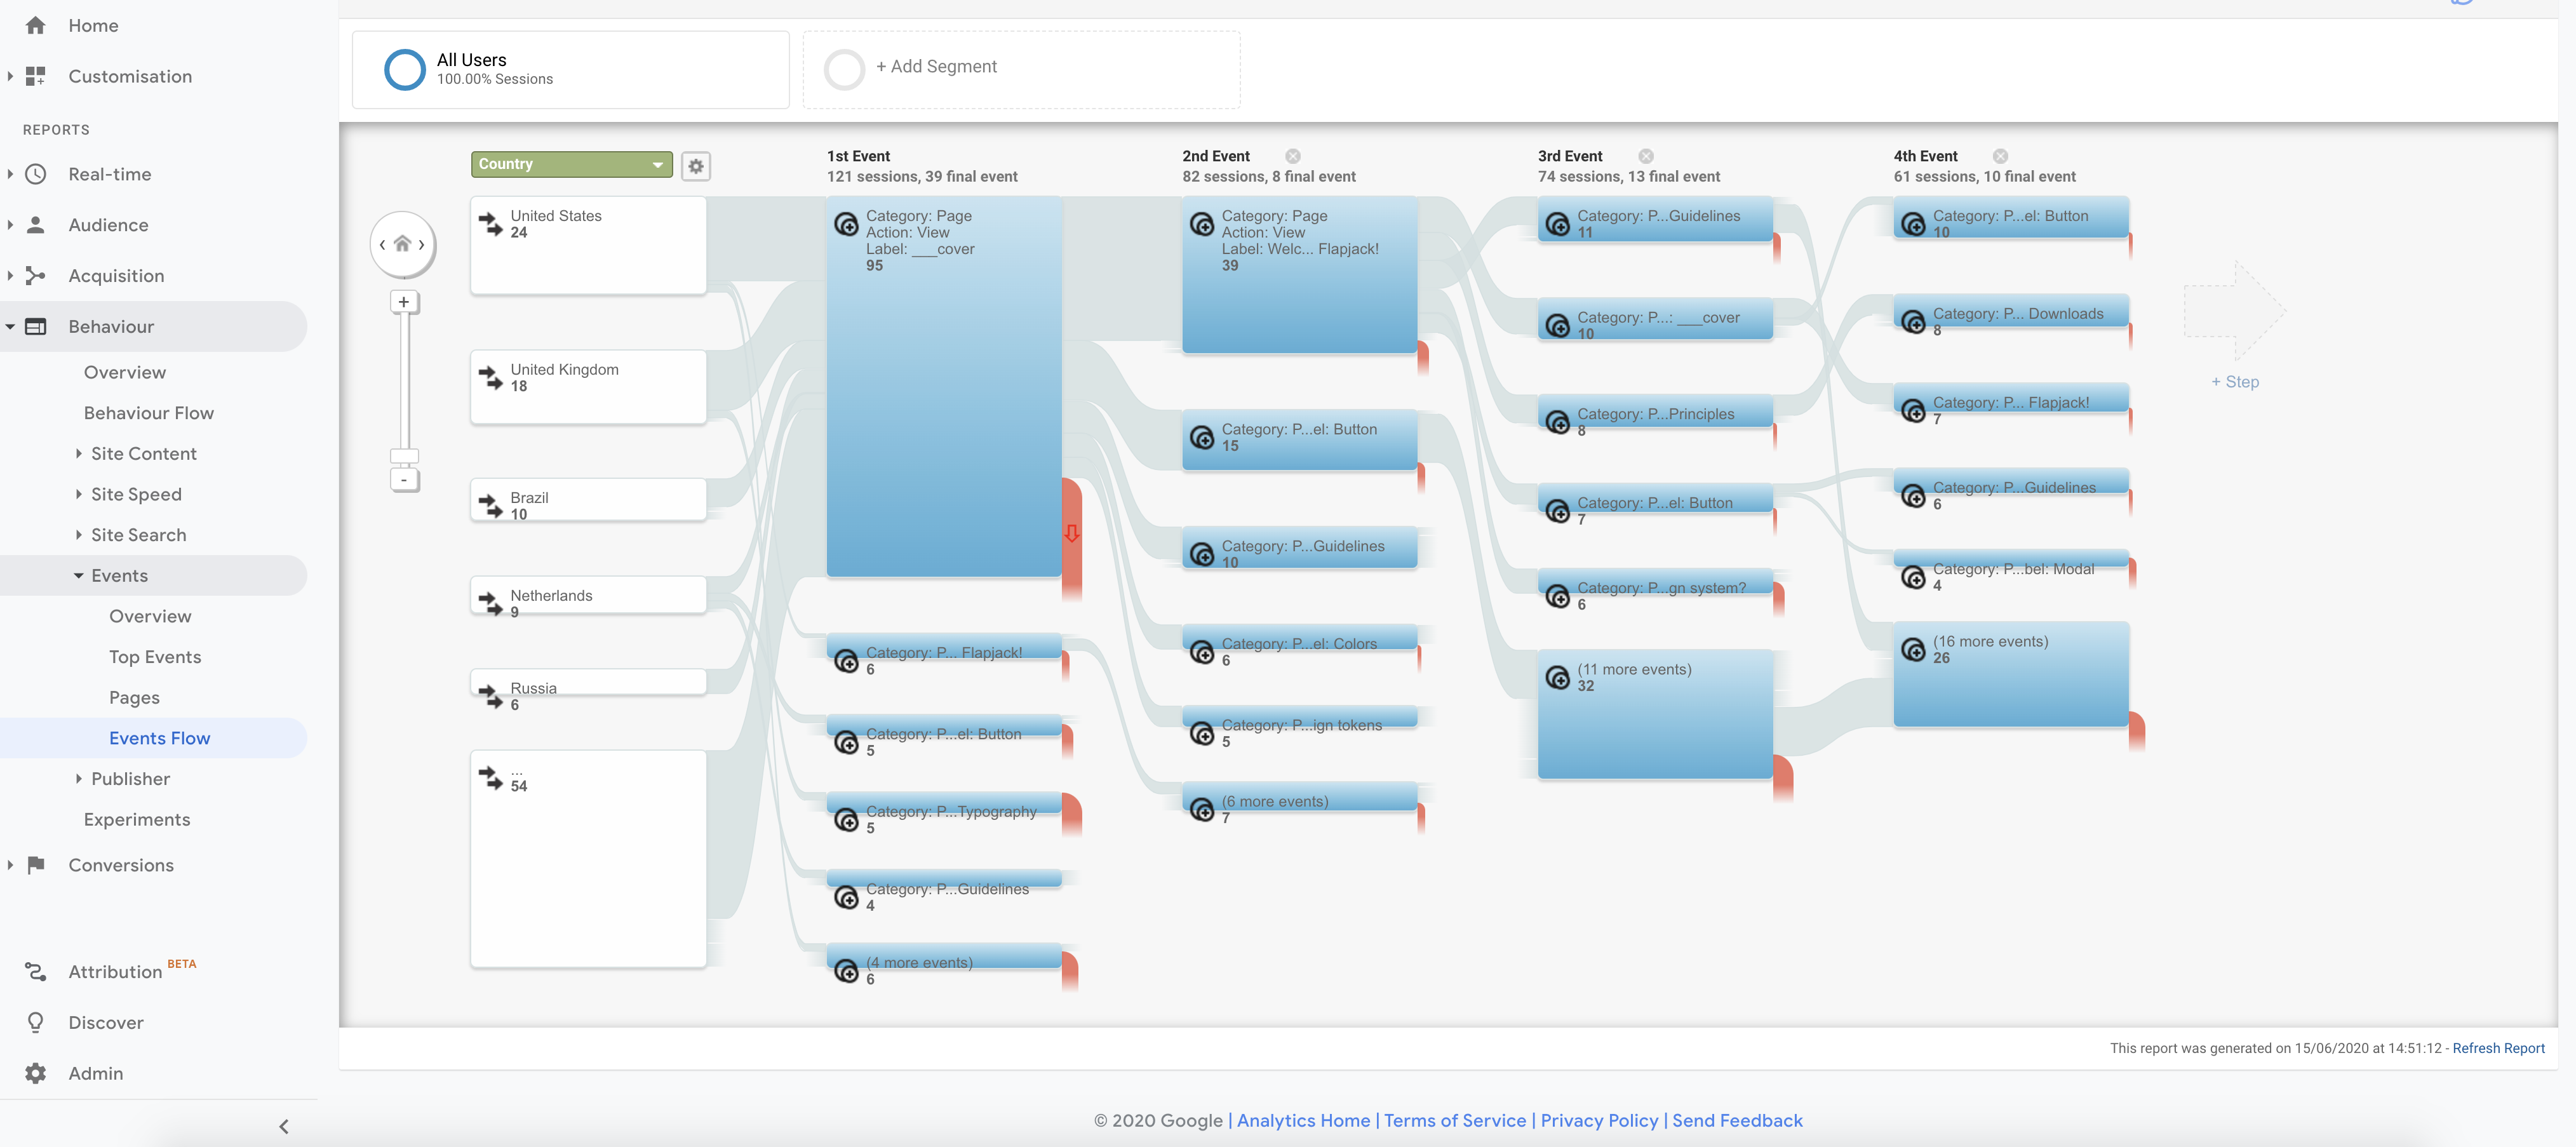
How are people navigating the styleguide?
Click on the Events Flow page to how your viewers navigate through the styleguide.
You can identify popular flows through the styleguide. If the majority of your viewers are looking at the first tab, shortcut tile, or component, you could consider rearranging your styleguide so the most important information is the first thing viewers click.
The flows in red indicate where people stopped looking at the documentation.
FAQs
Why can’t I see any pageviews in the Behavior > Overview section?
As zeroheight is a single-page application the page doesn’t refresh, so the user behavior is only tracked by events that happen on the page. It’s probably not the way you are used to seeing data in Google Analytics so you should visit the Behavior > Events section instead.
Will tracking cookies be collected if we set up Google Analytics?
Yes, as soon as you enter a tracking code into your styleguide then cookies will start tracking. You can add a cookie banner to your styleguide so that users know that you are using cookies (instructions on setting up a cookie banner).
In accordance with GDPR, viewers in the UK/EEA will only be tracked if they accept analytics cookies by clicking ‘Allow all’ in the cookie banner.
If my styleguide is secured behind Single-Sign On (SSO) can it still be tracked?
Yes, you can still set up Google Analytics on styleguides that are private.
If your team doesn’t use Google Analytics, try zeroheight analytics to gather feedback.